
These Interactive Maps Show How Segregation in Roanoke Has Evolved Over 50 Years
Explore how lines of residential segregation have proved difficult to erase in Roanoke.

When the Civil Rights Act banned racial discrimination in 1964, it marked a turning point in American history. A wave of legislative momentum surged through the rest of the decade, advancing equal rights in public schools, businesses, housing and the ballot box. As the ink dried on these reforms, the message was clear — by law, segregation had come to an end.
But today, the reality has been more complicated. In communities across the country, the lines of residential segregation have proved difficult to erase.
Those lines are especially evident in Roanoke, which has long been considered one of the most racially divided cities in Virginia. In a recent report, the National Institute on Minority Health and Health Disparities listed Roanoke as the fifth-most segregated locality in the state.
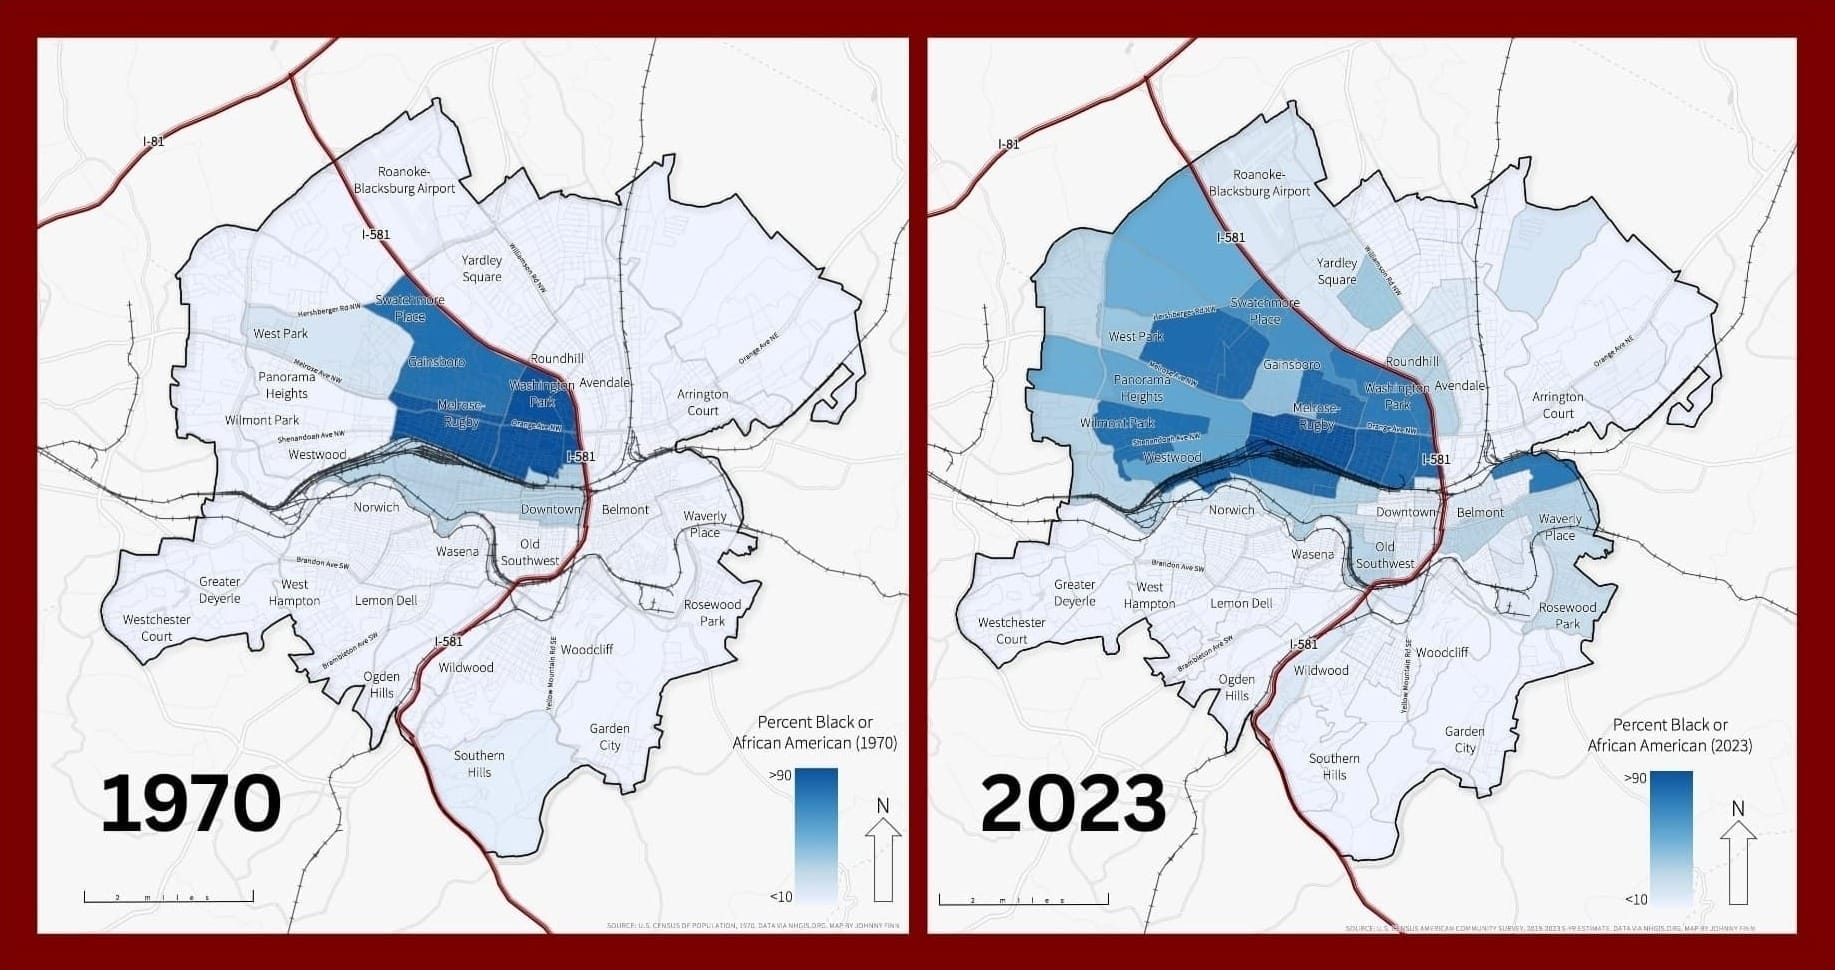
As part of The Roanoke Rambler’s ongoing coverage of segregation, we analyzed maps of the city’s racial geography from two key years: 1970 and 2023. The 1970 map captures Roanoke in the early aftermath of desegregation; the 2023 map reflects the most recent estimate of where Roanoke stands today.
Placed side by side, these snapshots tell a powerful story about how the Roanoke community has evolved over the decades — and how stubbornly segregation has endured.
How to explore the interactive map:
- Left panel: 1970. Right panel: 2023.
- Drag the slider across your screen to compare the two maps.
- Click on any tract to view a detailed breakdown of the population.
Segregation in Roanoke: 1970 (left) vs. 2023 (right)
Interactive map courtesy of Johnny Finn, Associate Professor of Geography at Christopher Newport University.
About the maps
This interactive map was developed for The Roanoke Rambler by Johnny Finn, a geographer at Christopher Newport University who researches the economic, environmental and health impacts of racial segregation.
The 1970 map is based on data from the U.S. Census, a nationwide population count collected every 10 years. The 2023 map uses data from the American Communities Survey, a five-year demographic estimate by the U.S. Census Bureau. Both maps use “Percent Black or African American” to reflect segregation because African Americans were the primary targets of segregation and disenfranchisement laws in Roanoke and throughout the country.
Over the years, Finn has studied and mapped racial geography in cities across Virginia, including Norfolk, Richmond and Charlottesville. These maps of Roanoke, he said, stand apart.
“I think the lines here seem to be starker and more durable than in most other places where I've worked,” Finn said.
Four key takeaways:
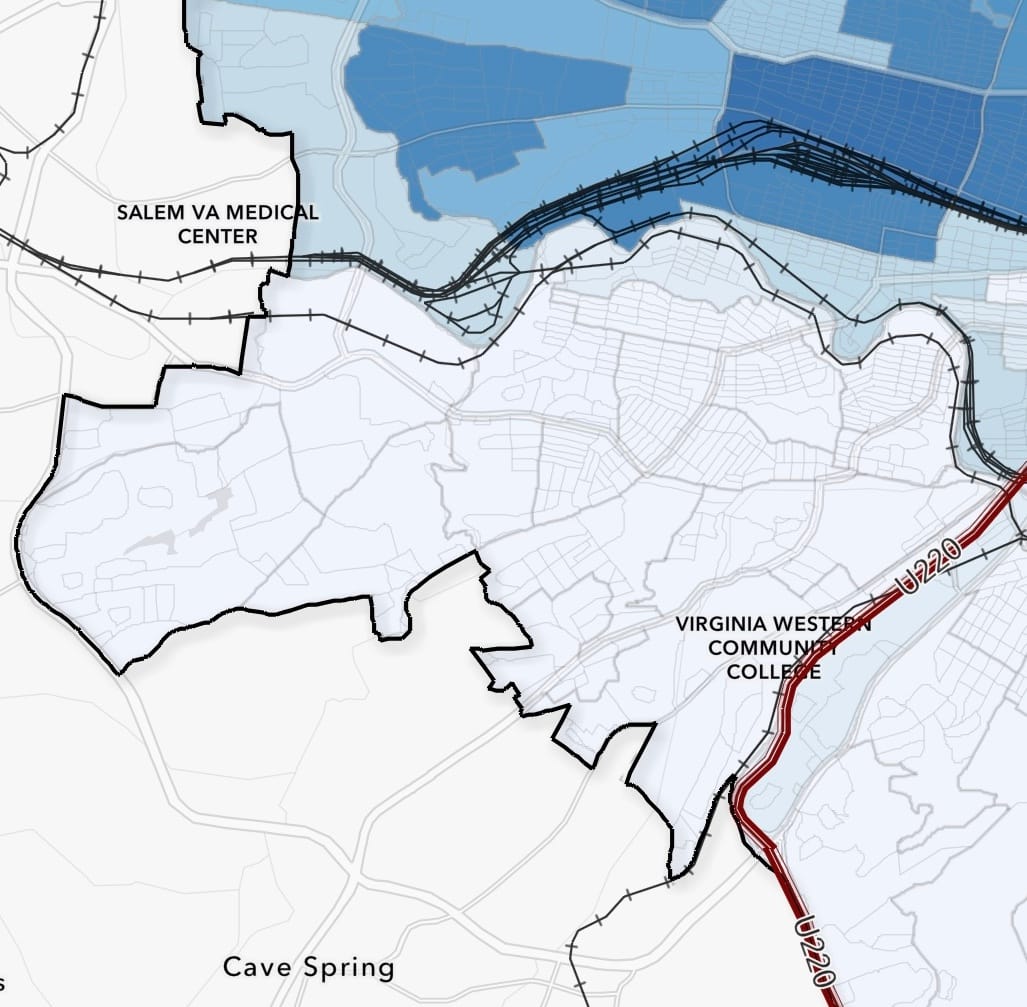
1. From 1970 to today, the railroad tracks and the highway have remained persistent dividing lines.
“The wrong side of the tracks” is a familiar metaphor used in American cities. But according to Finn, it’s more than a saying — historically, infrastructure has been wielded as a tool to segregate communities.
In Roanoke, railroad tracks running east to west split the city in half. While the tracks became an early symbol of economic growth, they also became the physical boundary separating Roanoke’s Black and white communities.
Another line cuts north to south: Interstate 581.
Built during urban renewal, I-581 was part of a wave of federal and local efforts that used eminent domain to demolish “blighted” areas — a designation often applied to low-income and minority communities — to make way for redevelopment. Even as the Civil Rights Act marked progress in the 1960s, urban renewal projects inflicted continued harm on Black communities.
In Roanoke, city leaders routed the highway directly through historically Black neighborhoods in Northeast Roanoke, displacing residents and reshaping the city’s racial geography. The 1970 map shows the aftermath of urban renewal, with nearly the entirety of Roanoke’s Black community forced west of the newly constructed highway.
Decades later, those lines of separation have remained. On the 2023 map, the darkest blue areas — representing the highest concentration of Black residents — are still overall tightly confined by these man-made boundaries.
“What you have in 1970 and persisting into the present day is effectively the railroad tracks to the south and the interstate highway to the northeast creating and maintaining really stark lines of racial segregation and racial separation,” Finn observed.
2. Northwest has experienced significant change.
While the dividing lines of the railroad and highway have remained firm, the community within those boundaries has evolved.
In 1970, census tracts in the far western half of the Northwest quadrant were more than 90 percent white. But by 2023, those same areas reflected a significant increase in Black residents.
Local historian and former mayor Nelson Harris attributes this shift to “white flight,” a term used to describe the migration of white residents away from areas becoming more racially diverse, often motivated by racism and fear of declining property values.
“In the late ‘60s and ‘70s, you then had white flight into [Roanoke] County due to the integration of the schools,” Harris said while assessing the 1970 map.
“What has developed here,” he said, pointing to the 2023 map, “is that as the white community moved into the county, then the Black community basically moved west.”
3. Overall, highly racially segregated neighborhoods have decreased significantly since 1970, especially in Southeast.
From 1970 to 2023, neighborhoods that were extremely segregated (80 percent or more one race) declined sharply.
In 1970:
- 94% of white residents lived in neighborhoods that were 80% or more white and
- 50% of Black residents lived in communities that were 80% or more Black
Over the years, those numbers dropped significantly.
In 2023:
- 36% of white residents lived in neighborhoods that were 80% or more white and
- 17% of Black residents lived in communities that were 80% or more Black
That change is especially evident in Southeast Roanoke. While in 1970, most sections of the quadrant were nearly 100 percent white, in 2023, the number of Black residents there increased substantially.
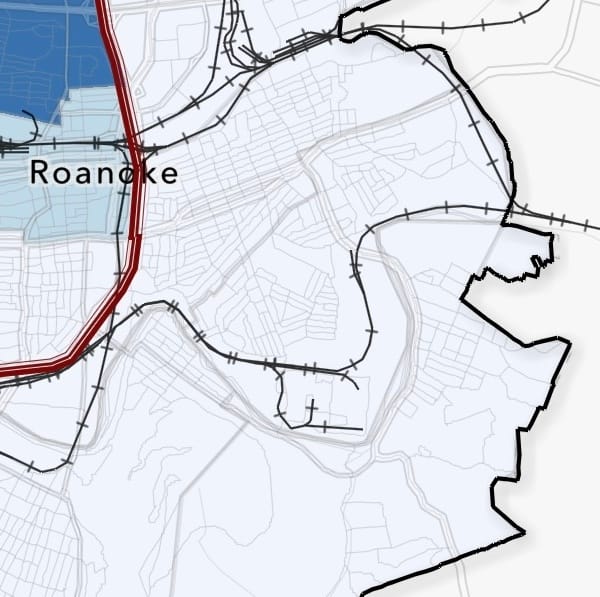
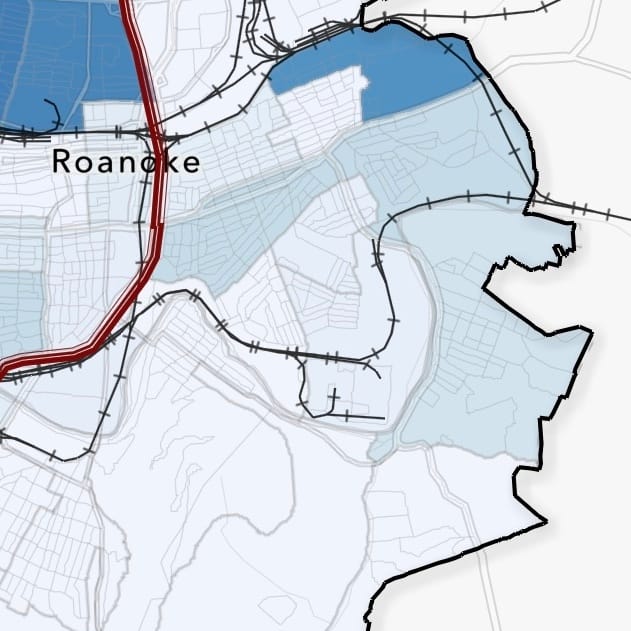
Left: Southeast Roanoke in 1970. Right: Southeast Roanoke in 2023.
4. But today, some of those highly segregated neighborhoods still exist — especially those that are majority white.
In 2023, white residents were more than 3 times as likely as Black residents to live in neighborhoods that were 90 percent or more their same race.
This pattern is especially clear in Southwest Roanoke. Scrolling across the maps reveals a striking lack of visible change — over 53 years, the number of Black residents living in this section of the city has remained remarkably slim.
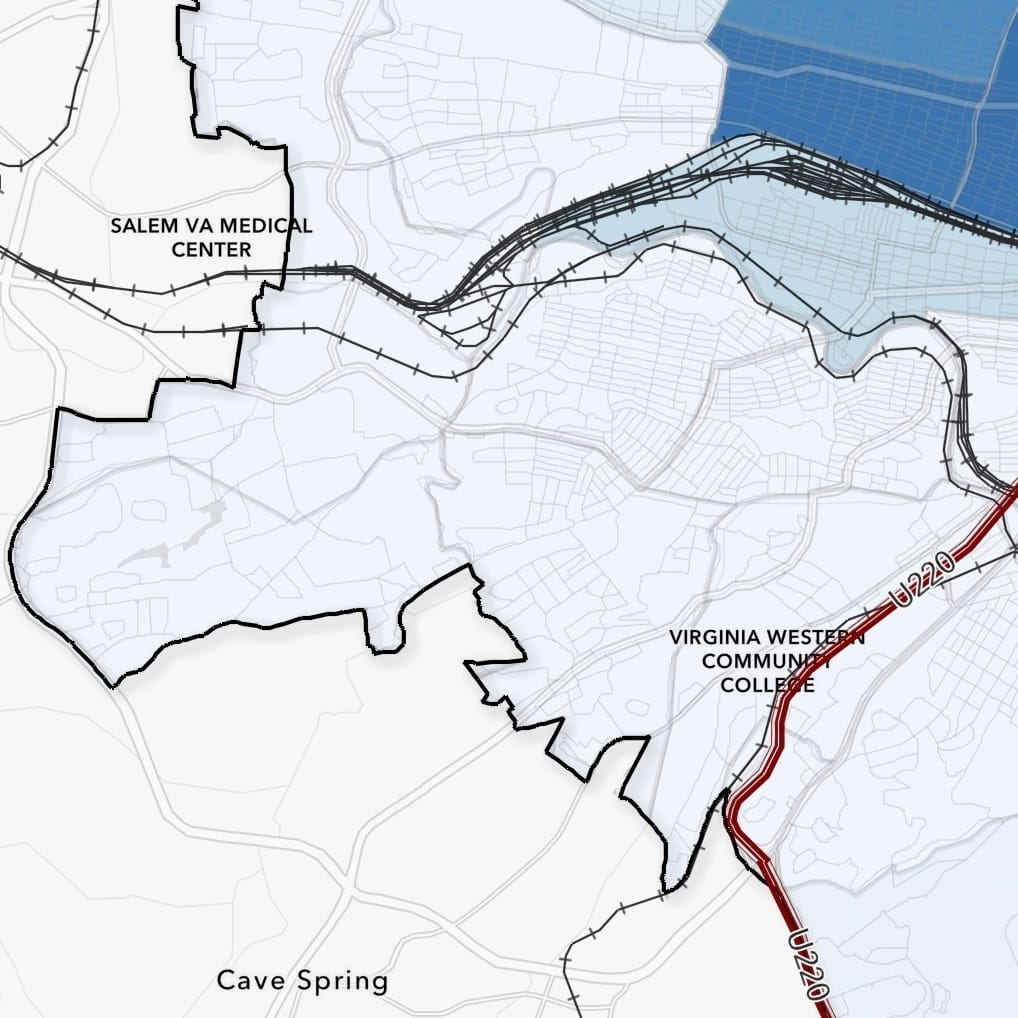
Left: Southwest Roanoke in 1970. Right: Southwest Roanoke in 2023.
According to Harris, the minimal changes in Southwest can be explained by the history of housing discrimination.
Across the U.S., racially restrictive covenants — discriminatory clauses written into property deeds — explicitly banned non-white buyers from purchasing certain homes. Through his research, Harris discovered these racist restrictions embedded in the early deeds of Southwest homes.
“In the two or three neighborhoods that we would now call Raleigh Court,” he said, “the developers would put in deed restrictions that nobody could own that property if they were Black, if they were Jewish, if they were Syrian.”
While these covenants were outlawed by the 1968 Fair Housing Act, their impact has endured, Harris said.
“These early neighborhoods of a century ago were created by whites, for whites,” he said. "And so that, from a historic perspective, then kind of added to this idea — this is the white section. Over there is the Black section. And we all stay in our sections.”
Diverse, but divided
Roanoke is recognized as one of the most diverse cities in Southwest Virginia. But at the neighborhood level, that diversity often disappears.
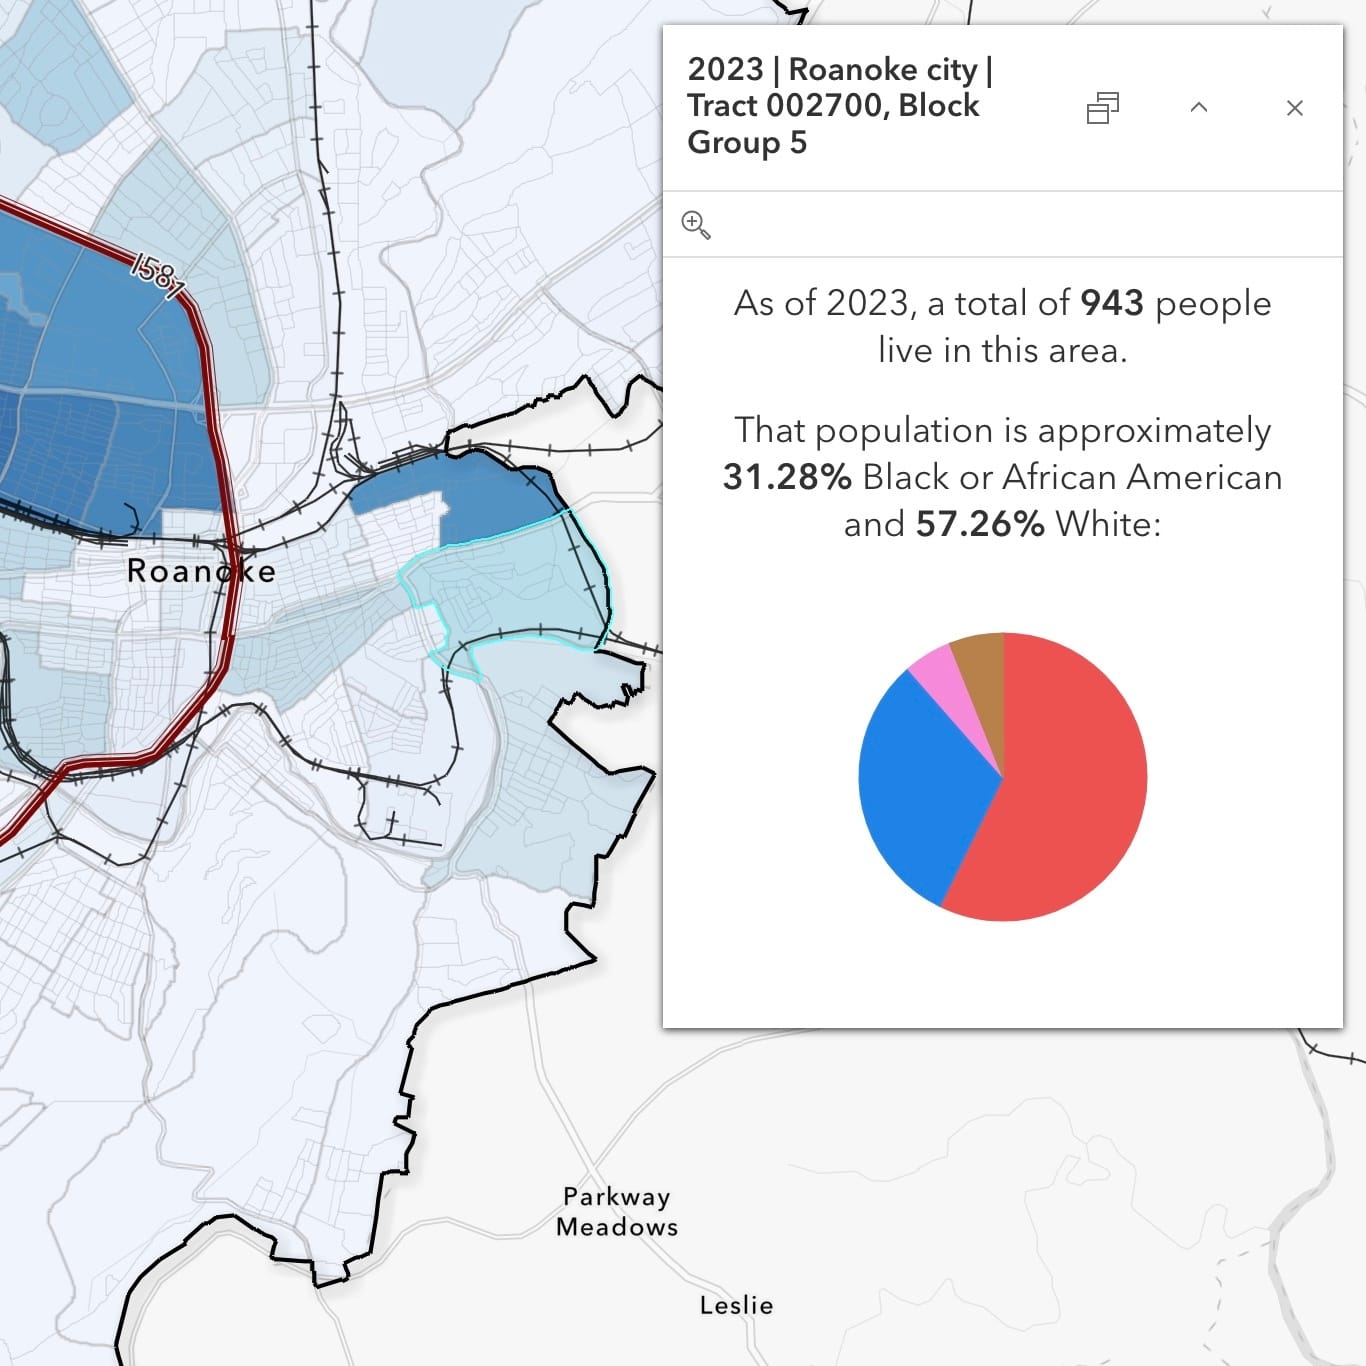
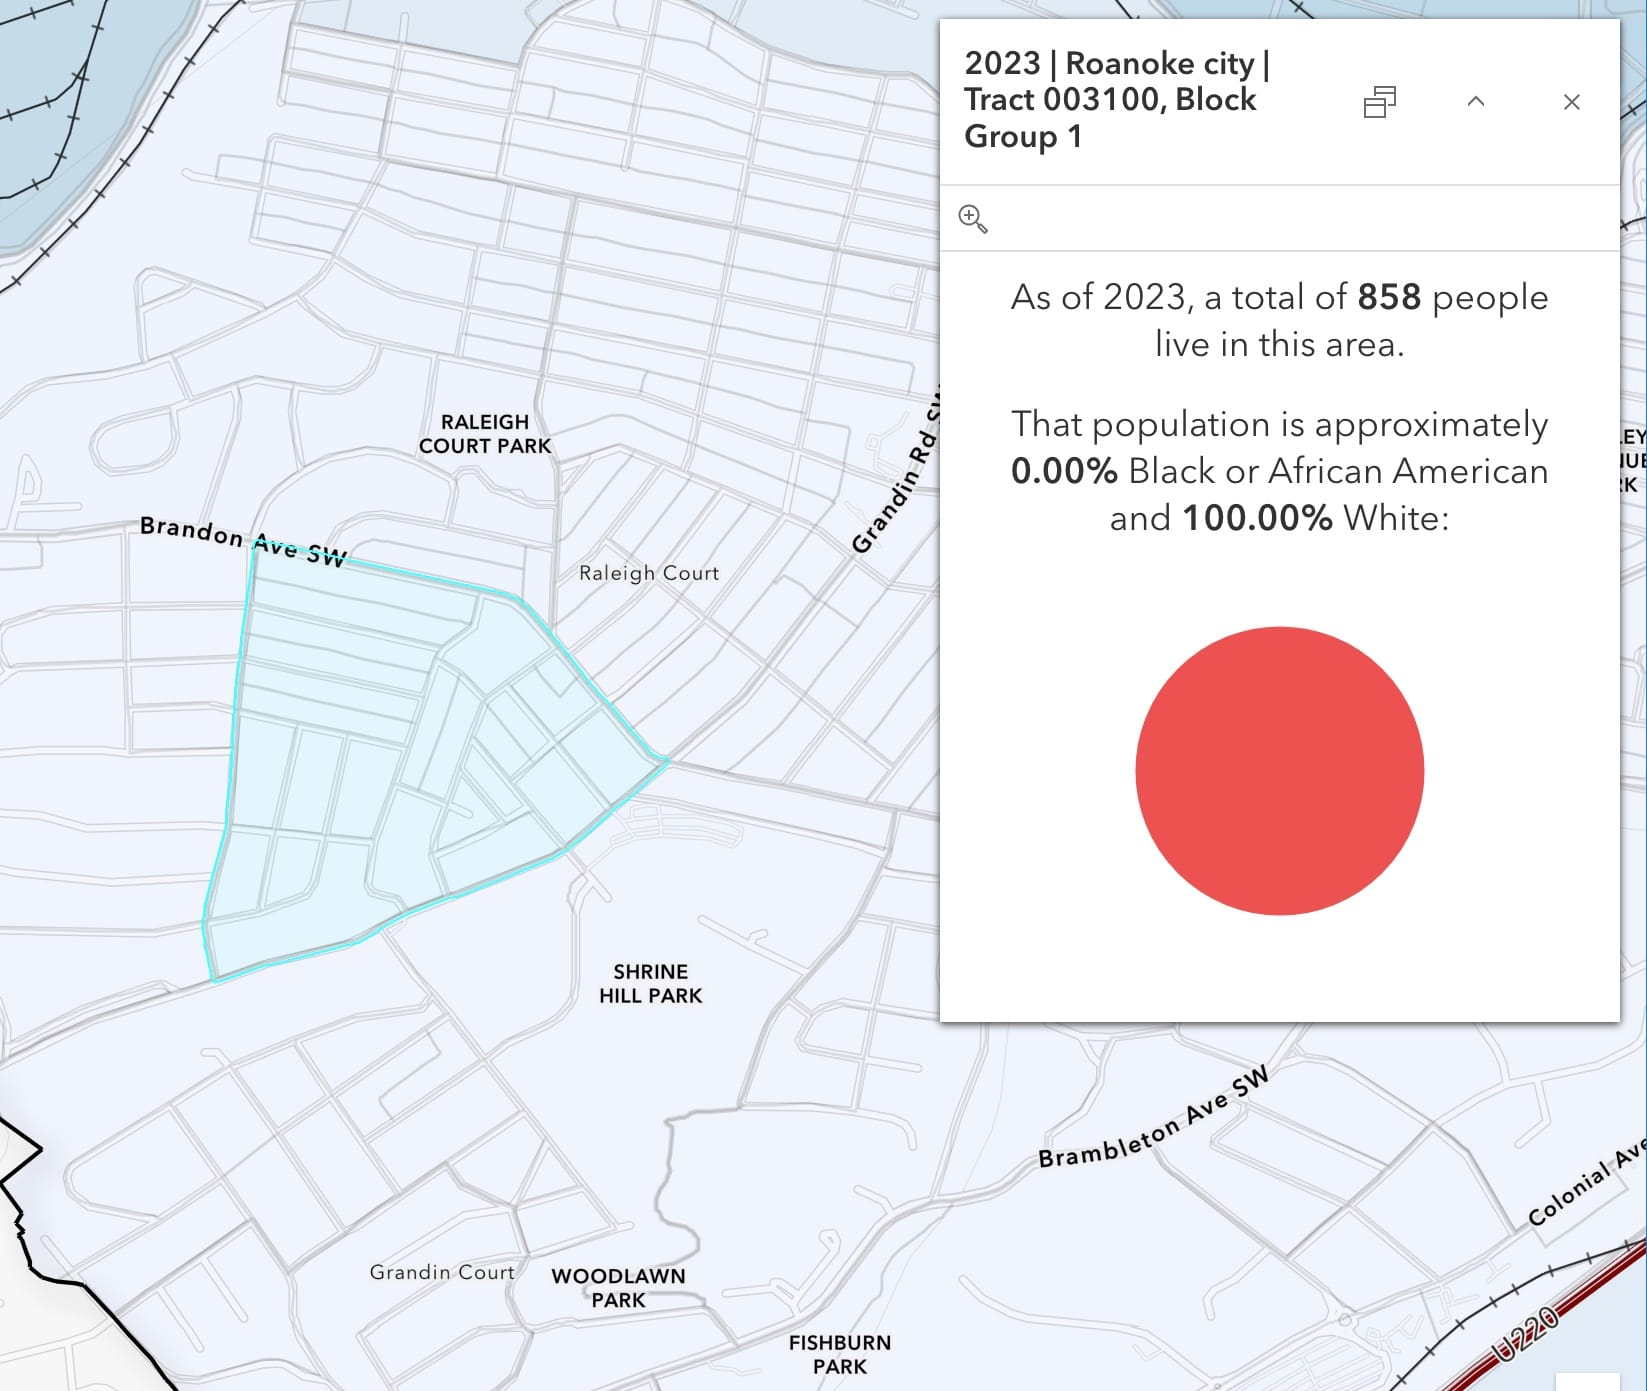
Left: In Southeast Roanoke, Tract 002700 closely mirrors Roanoke's overall population, about 55.5% white and 28.5% Black. Right: Most other areas do not. Tract 003100 in Southwest is 100% white.
Jordan Bell, a local historian and neighborhood activist, viewed both maps with The Rambler. To him, they reveal a reality that Roanoke still struggles to confront.
“Something that Roanoke has had a hard time at admitting to, and Roanoke City Council has had a hard time admitting to, is that we still have a very deep segregation problem here,” he said. “From housing, to jobs, to schools, to whatever you want to name, we still have a huge segregation problem here.”
That reality often goes unnoticed. In Harris’ research experience, he found that residents of Southwest Roanoke were shocked to learn about the history of segregation embedded in their own neighborhoods — and even in the deeds of their own homes.
“You know, we tend to think of Roanoke as kind of a progressive community,” Harris said. “So people were surprised when they think back 100 years, you know, that a Black person couldn’t have bought my house, or a Jewish person couldn’t have bought my house, because of these overt deed restrictions.”
While progress is visible — including some neighborhoods where the population now mirrors citywide demographics — large portions of Roanoke remain starkly segregated. In many neighborhoods, Black residents still make up less than 10 percent of the population.
As lines of segregation persist, Bell pointed out the disconnect between the perception of diversity in Roanoke and the lived reality of ongoing separation.
“When people say [Roanoke] is integrated, they’re taught that, you know, they walk out their front door and across the street they see a Black family,” Bell said. “Well, if there’s 100 homes in the neighborhood and there’s only two black families, is there really integration? Is there really an integrated community?”